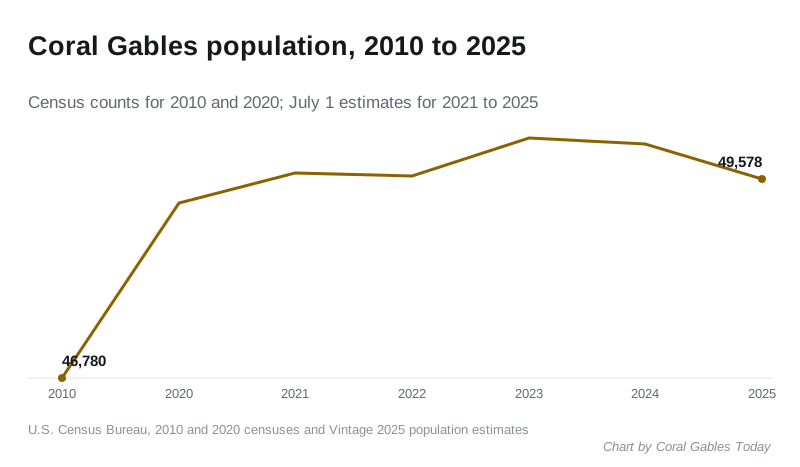
Coral Gables had an estimated 49,578 residents on July 1, 2025, up 0.7% from the 2020 census count of 49,248 and 6% above 2010. Age, income and housing.
Last checked Oct. 8, 2026. Figures come from the U.S. Census Bureau: the 2010 and 2020 censuses, the Vintage 2025 population estimates and the 2020-2024 American Community Survey 5-year estimates. Census Bureau questions: census.gov/about/contact-us.
Coral Gables had an estimated 49,578 residents on July 1, 2025, according to the Census Bureau. That is up 0.7% from the 2020 census count of 49,248 and 6% above the 46,780 counted in 2010. The city’s population has hovered around 50,000 since 2020, while Miami-Dade County as a whole added about 100,000 people.
What this means for you
- Coral Gables’ population has changed little from year to year since 2020.
- Households here earn almost twice the county median and are smaller than the county average.
- About two in three homes are owner-occupied, compared with about half countywide.
Population over time
| Year | Population | Source |
|---|---|---|
| 2010 | 46,780 | 2010 census |
| 2020 | 49,248 | 2020 census |
| 2021 | 49,669 | July 1 estimate |
| 2022 | 49,623 | July 1 estimate |
| 2023 | 50,156 | July 1 estimate |
| 2024 | 50,079 | July 1 estimate |
| 2025 | 49,578 | July 1 estimate |
Estimates are revised each year, so an earlier year’s figure can change in later releases. The 2023 estimate was the first above 50,000.
Who lives here
From the 2020-2024 American Community Survey, which averages five years of survey responses:
| Measure | Coral Gables | Miami-Dade County |
|---|---|---|
| Median age | 39.1 | 40.7 |
| Residents 65 and older | 18.9% | 16.9% |
| Born outside the U.S. | 37.7% | 54.5% |
| Speak a language other than English at home (age 5+) | 60.7% | 75.3% |
| Households | 19,210 | 975,411 |
| Average household size | 2.28 | 2.76 |
| Median household income | $134,216 | $71,753 |
| People below the poverty level | 9.4% | 14.7% |
| Adults 25+ with a bachelor’s degree or higher | 73.6% | 34.4% |
| Housing units | 22,020 | 1,094,983 |
| Homes that are owner-occupied | 64.5% | 52.2% |
| Median value of owner-occupied homes | $1,089,900 | $463,000 |
| Median gross rent | $2,373 | $1,829 |
The survey figures have margins of error; small differences between places may not be meaningful. Full tables: social (DP02), economic (DP03) and housing (DP04). The Census Bureau’s QuickFacts for Coral Gables summarizes the same sources.
Coral Gables and its neighbors
| Place | 2010 census | 2020 census | 2025 estimate | Change 2020-2025 | Median household income |
|---|---|---|---|---|---|
| Coral Gables | 46,780 | 49,248 | 49,578 | +0.7% | $134,216 |
| South Miami | 11,657 | 12,026 | 13,660 | +13.6% | $94,507 |
| Pinecrest | 18,223 | 18,388 | 18,635 | +1.3% | $206,417 |
| Palmetto Bay | 23,410 | 24,439 | 24,886 | +1.8% | $142,447 |
| West Miami | 5,965 | 7,233 | 7,125 | -1.5% | $61,274 |
| Miami | 399,457 | 442,241 | 489,812 | +10.8% | |
| Miami-Dade County | 2,496,435 | 2,701,767 | 2,802,029 | +3.7% | $71,753 |
Income is the ACS 2020-2024 median for each place. South Miami grew fastest among the smaller neighbors, and the City of Miami added more than 47,000 people.
About these numbers
- The census counts everyone every 10 years; the next count is in 2030.
- Yearly estimates start from the 2020 count and add births, deaths and migration.
More: Coral Gables home prices, schools and moving to Coral Gables.
Frequently asked questions
What is the population of Coral Gables?
The Census Bureau estimates 49,578 people lived in Coral Gables on July 1, 2025. The 2020 census counted 49,248.
Is Coral Gables growing?
Slowly. The population rose 5.3% from 2010 to 2020 and 0.7% from the 2020 census to the 2025 estimate, while Miami-Dade County grew 3.7% over the same five years.
What is the median household income in Coral Gables?
$134,216, according to the Census Bureau’s American Community Survey for 2020-2024, almost twice the Miami-Dade County figure of $71,753.
What is the median age in Coral Gables?
39.1 years, and 18.9% of residents are 65 or older, according to the 2020-2024 American Community Survey.
Have your say